TL;DR
This benchmark compares two concrete systems: LiteParse 2.2.0 as the document-parser baseline, and Gemini 3 Flash Lite as the page-level vision-language model.
The comparison is not meant to rank every OCR or document-AI tool. It asks a narrower question: when the same annual-report pages are parsed by LiteParse or shown as rendered images to Gemini, which facts are recovered, and where does visual understanding add measurable value?
- LiteParse is strong on native PDFs. It extracted the boAt financial table with all 12 numeric values and usable markdown tables in 25 ms.
- The VLM edge is not basic OCR. Gemini 3 Flash Lite still wins where the page meaning lives in charts, maps, project photos, certificate thumbnails, and visual relationships.
- The comparison is balanced. LiteParse is a real contender on text and tables; Gemini's advantage is clearer on pages where visual context changes the answer.

Scoring basis. Text-item recall is exact string recall over 57 pre-declared ground-truth text items across the four pages. Numeric-value recall is exact string recall over 14 declared numeric values: 12 table values plus the 75% / 25% sales split. Table-header preservation counts whether the two dates and three column labels for each year appear inside the markdown table header, for 8 possible header cells. Visual-semantic facts count six pre-declared visual facts that require interpreting images rather than only extracting nearby text: domestic/export icon binding, export-map meaning, India-map meaning, certificate identities, project-photo scene descriptions, and caption-photo binding.
The two-system baseline
The benchmark uses LiteParse as the parser path and Gemini as the vision-language path. LiteParse receives the source PDFs and emits markdown, tables, extracted images, and layout-oriented output. Gemini receives rendered page images and is prompted to extract both text and visual facts from the full page.
| System | Input used in this benchmark | What it tests |
|---|---|---|
| LiteParse 2.2.0 | Original PDF pages | Fast local parsing, markdown tables, text recall, numeric recall, and whether table headers remain attached to the table body. |
| Gemini 3 Flash Lite | Rendered page images | Page-level extraction across text, tables, maps, charts, photos, icons, and relationships between visual elements. |
The benchmark
The test set contains four annual-report pages: a visual global-presence spread, a financial table, a dense text page, and a project-photo grid. The input PDFs were parsed with LiteParse, while rendered page images were sent to Gemini 3 Flash Lite with an extraction prompt.
| Page | What's on it | What it stresses |
|---|---|---|
| Chart visual | World map of export markets, domestic/export sales infographic, certificate thumbnails | Non-textual visual content |
| Financial table | Two stacked credit-risk tables with merged headers | Tabular structure and numeric recall |
| Dense text | Plain accounting policy commentary on PP&E | Fairness check for native text |
| Image captions | Eight project photos in a 4x2 grid with captions | Caption-to-image binding and photo semantics |
Example 1: financial table
Page 118 of Imagine Marketing's standalone financial statements contains two credit-risk tables. LiteParse handles the values well, while Gemini does better on the table header semantics.
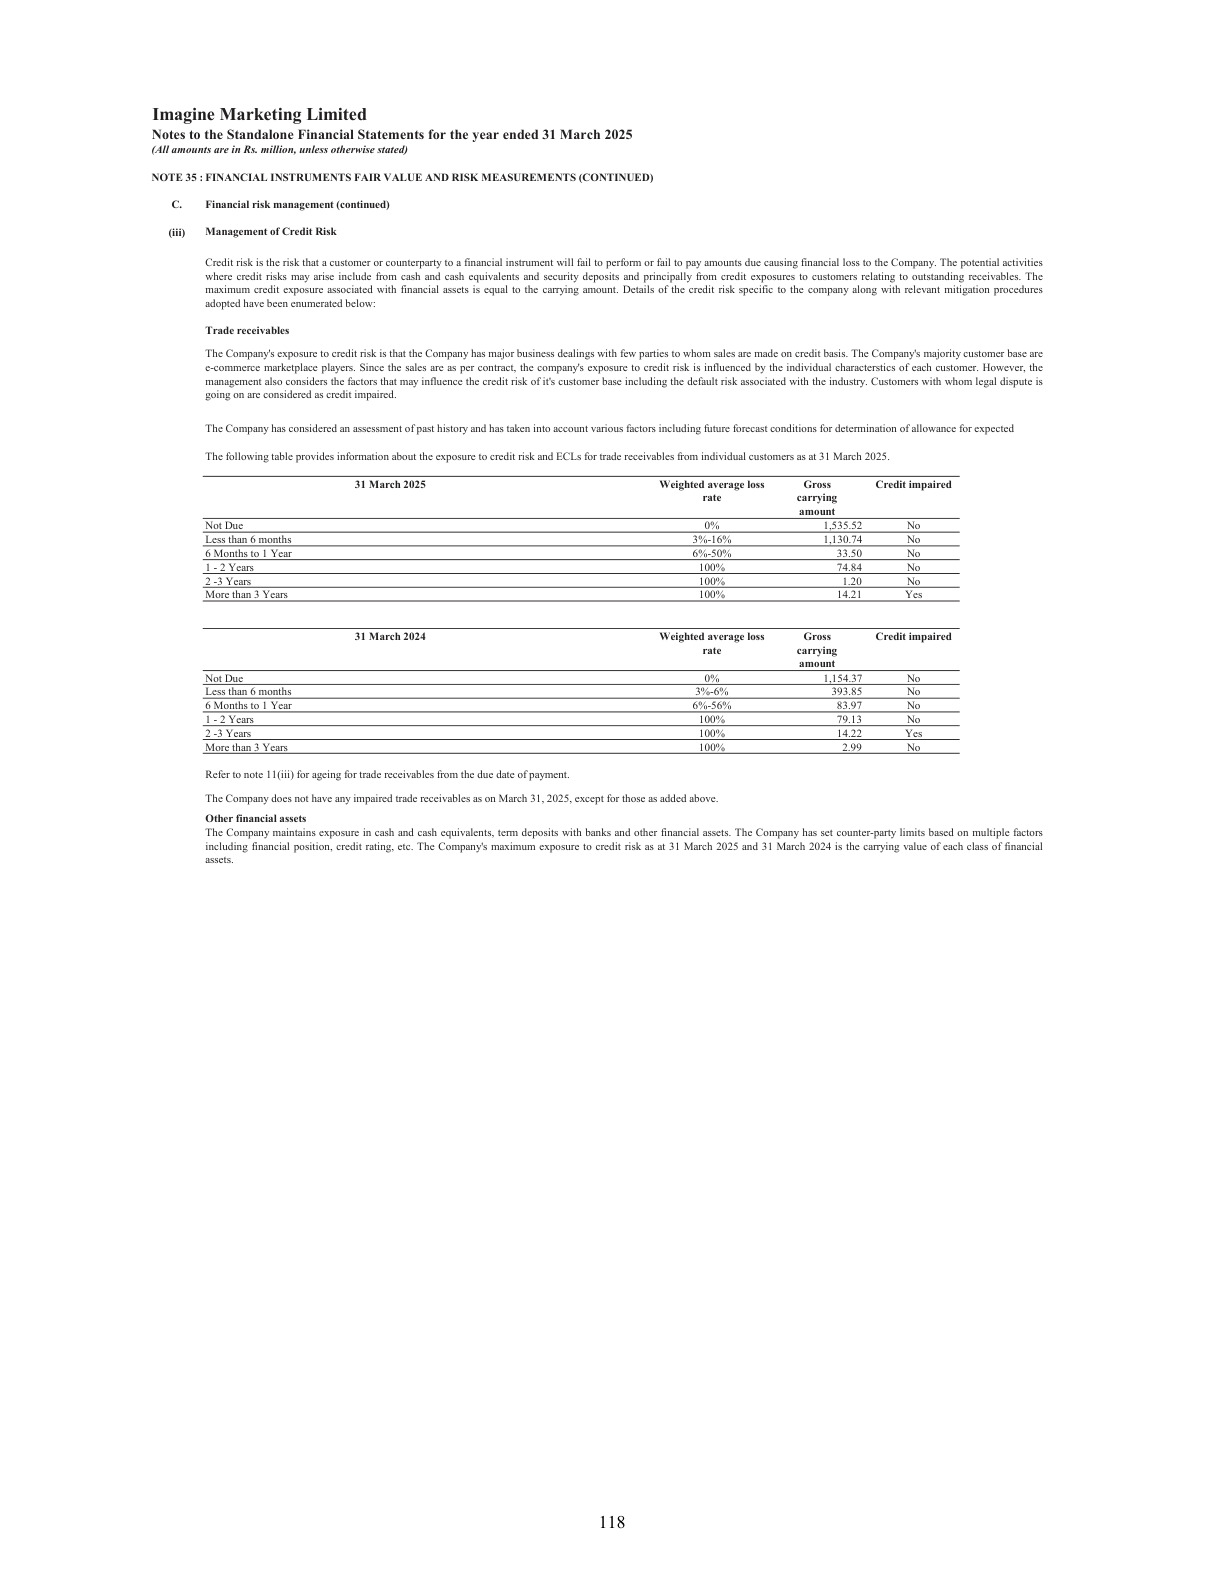
| Not Due | 0% | 1,535.52 | No |
|---|---|---|---|
| Less than6 months | 3%-16% | 1,130.74 | No |
| 6 Months to 1 Year | 6%-50% | 33.50 | No |
| 1 - 2 Years | 100% | 74.84 | No |
| 2 -3Years | 100% | 1.20 | No |
| More than3 Years | 100% | 14.21 | Yes |

| Not Due | 0% | 1,154.37 | No |
|---|---|---|---|
| Less than6 months | 3%-6% | 393.85 | No |
| 6 Months to 1 Year | 6%-56% | 83.97 | No |
| 1 - 2 Years | 100% | 79.13 | No |
| 2 -3Years | 100% | 14.22 | Yes |
| More than3 Years | 100% | 2.99 | No |
| 31 March 2025 | Weighted average loss rate | Gross carrying amount | Credit impaired |
| :--- | :--- | :--- | :--- |
| Not Due | 0% | 1,535.52 | No |
| Less than 6 months | 3%-16% | 1,130.74 | No |
| 6 Months to 1 Year | 6%-50% | 33.50 | No |
| 1 - 2 Years | 100% | 74.84 | No |
| 2 -3 Years | 100% | 1.20 | No |
| More than 3 Years | 100% | 14.21 | Yes |

| 31 March 2024 | Weighted average loss rate | Gross carrying amount | Credit impaired |
| :--- | :--- | :--- | :--- |
| Not Due | 0% | 1,154.37 | No |
| Less than 6 months | 3%-6% | 393.85 | No |
| 6 Months to 1 Year | 6%-56% | 83.97 | No |
| 1 - 2 Years | 100% | 79.13 | No |
| 2 -3 Years | 100% | 14.22 | Yes |
| More than 3 Years | 100% | 2.99 | No |
This is not a basic OCR failure story. LiteParse recovers every target value and emits the rows in a usable markdown table. The important caveat is the header: LiteParse leaves the year and column labels outside the table body, while Gemini places each date and column label inside the table header. So the numeric benchmark is tied, but the header benchmark is not: both systems recover 12 / 12 values, while Gemini preserves 8 / 8 table-header cells and LiteParse preserves 0 / 8 inside the table. 12 / 12 values for both · 8 / 8 headers for Gemini

Example 2: maps, charts, and certificates
The Goodluck India global-presence spread is where text parsing and document understanding separate again.
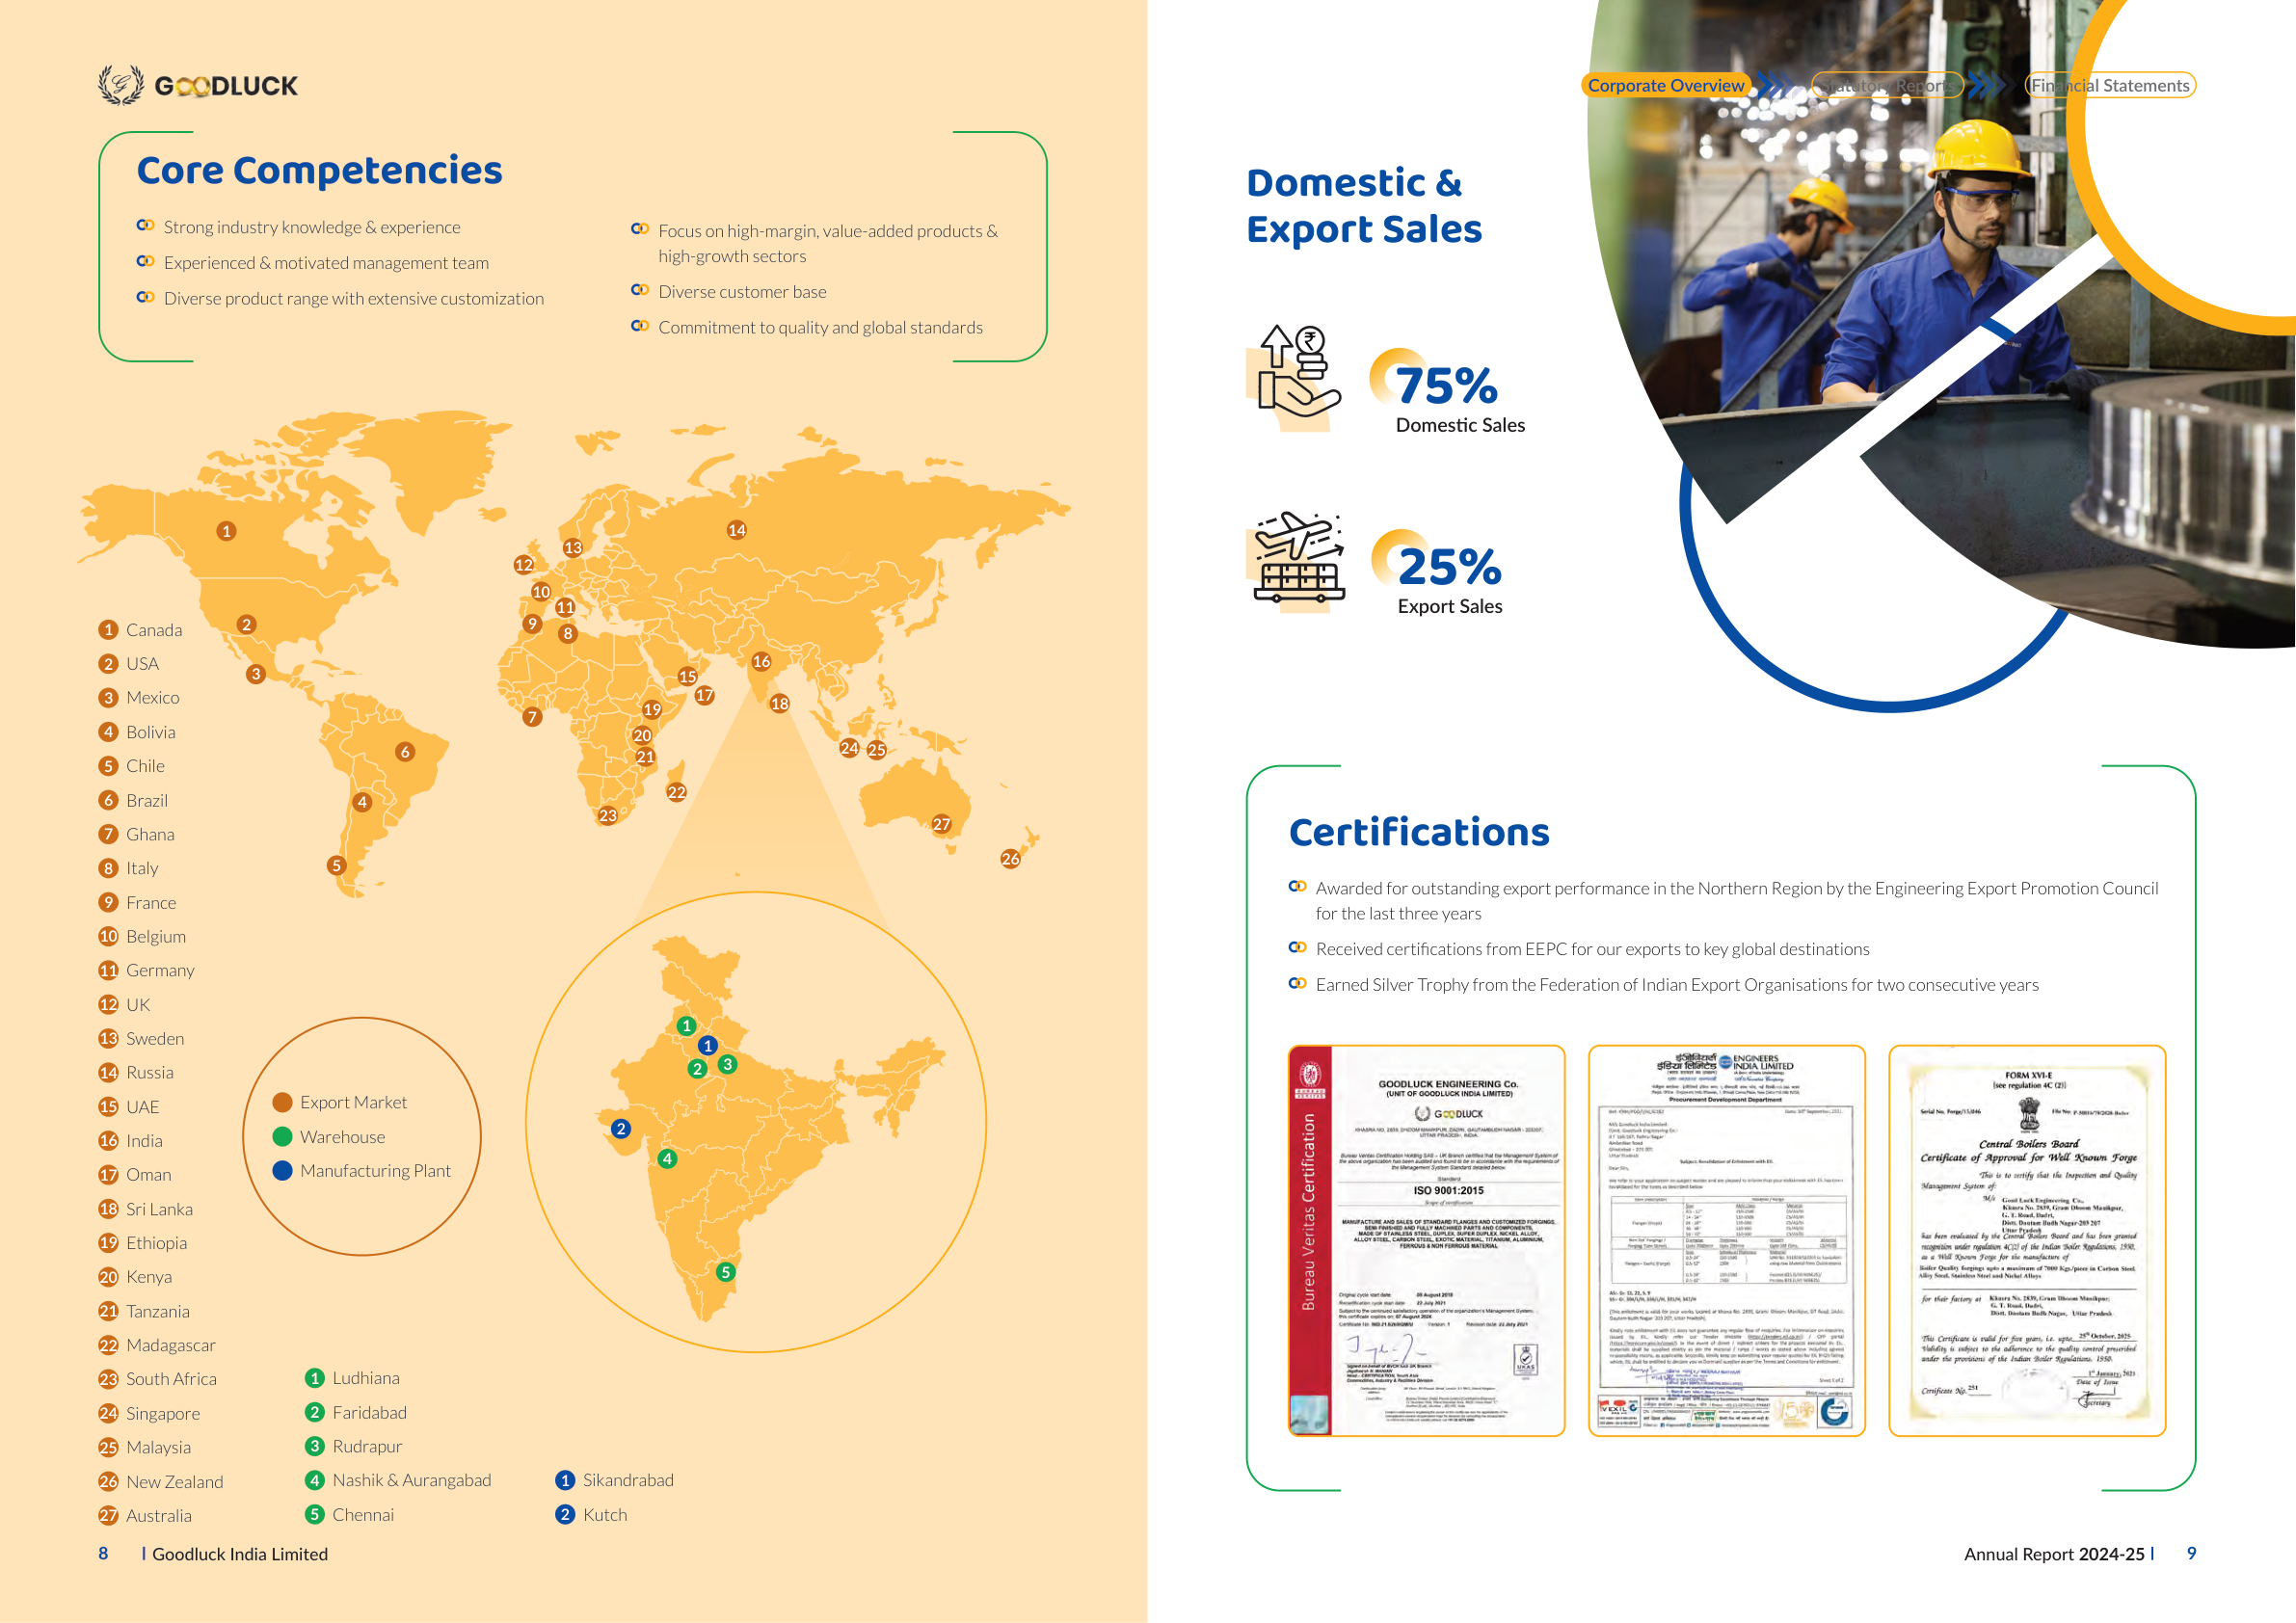
75%

### Domestic Sales

**1 14 25%**

### 11 Export Sales

**1** Canada **2 8 9** **2** USA **16**
**3 15**
**3** Mexico **17 18**
...
@ Export Market
@ Warehouse
@ Manufacturing Plant

| 23 South Africa 24 Singapore 25 Malaysia | 1 Ludhiana 2 Faridabad 3 Rudrapur |
|---|---|
| 26 New Zealand | 4 Nashik & Aurangabad |
| 27 Australia | 5 Chennai |
Domestic & Export Sales:
  Domestic Sales: 75% (icon of a hand holding a coin).
  Export Sales:   25% (icon of an airplane).

World map highlights 27 export-market locations.
A zoomed-in inset map of India shows manufacturing
plants and warehouses.

Certifications:
  - Bureau Veritas ISO 9001:2015
  - Engineers India Limited procurement document
  - Central Boilers Board Certificate of Approval
    for Well Known Forge
LiteParse preserves many country labels, percentages, image placeholders, and some table-like grouping. But it does not say what the image means. Gemini binds the 75% to domestic sales, the 25% to export sales, the dots to map locations, and the thumbnail images to certificate categories. That is the VLM advantage on this page.
The VLM win is not over basic table extraction on native PDFs. It shows up when the page is communicating through layout, icons, maps, charts, or photographs.
Example 3: project photos with captions
The second Goodluck spread shows eight engineering projects as photographs with one-line captions.
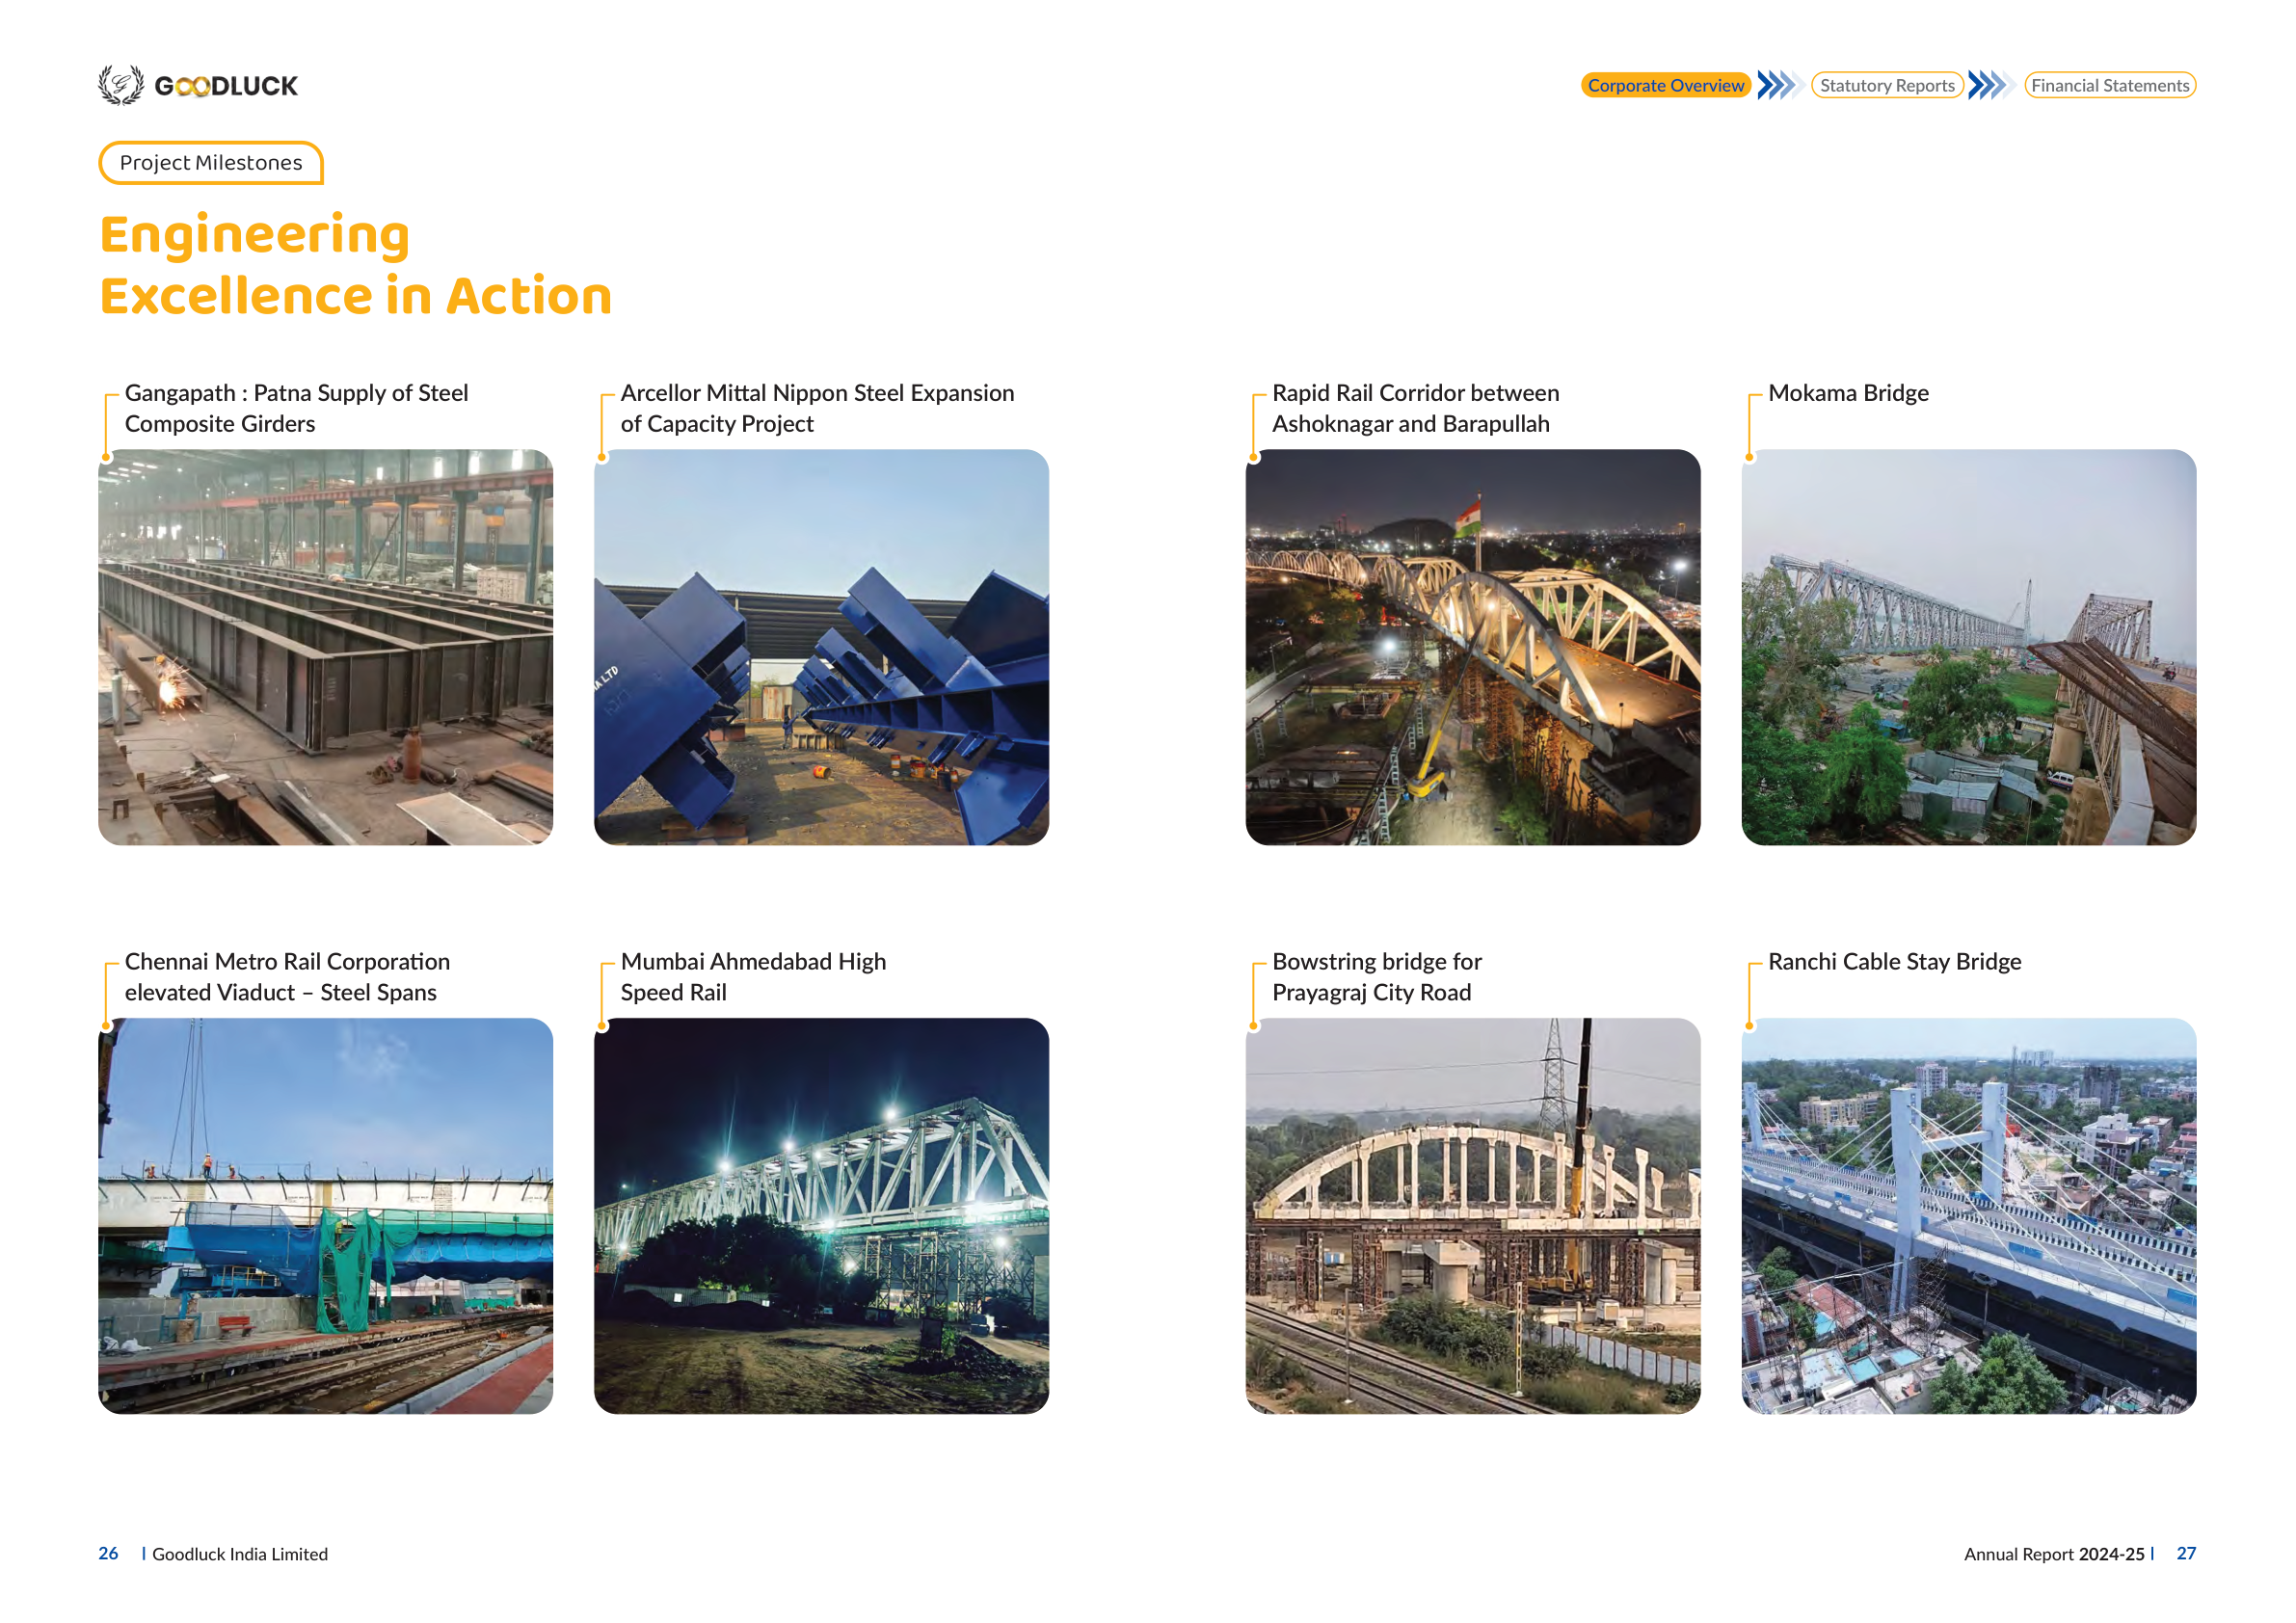
LiteParse extracts the captions and image objects:
Gangapath : Patna Supply of Steel
Arcellor Mittal Nippon Steel Expansion
Rapid Rail Corridor between
Mokama Bridge Composite Girders
...

Gemini goes further and describes the visual content of each photo: fabricated steel girders on a workshop floor, an illuminated bridge structure, a metro construction site, and an aerial view of a cable-stayed bridge. That is a different kind of output from caption extraction: it turns the photos themselves into searchable evidence, not just the text below them.
The numbers


Latency is also part of the story. On the two boAt native-text pages, LiteParse finished in 25 ms and 8 ms. Gemini took roughly six seconds per rendered page. That makes the comparison less about which tool is universally "better" and more about what kind of information is actually present on the page.
Benchmark notes: LiteParse 2.2.0 was run locally on the source PDFs. Gemini 3 Flash Lite was run on rendered page images. The opening scorecard uses a fixed, pre-declared rubric: 57 exact-match text items, 14 exact-match numeric values, 8 table-header cells, and 6 visual-semantic facts. A hit means the extracted output contains the expected string or visual fact in the right context; model confidence scores are not used. Tool references: LiteParse docs and LiteParse announcement.