TL;DR
OCR was designed to convert pixels of letters into strings of letters. That's it. A modern vision transformer (ViT) does not have that limitation — it ingests a page the way a human does: as a 2-D arrangement of words, tables, charts, icons, and pictures, and reasons over all of it jointly.
On four representative annual-report pages, the gap is large enough to settle the question — and the multimodal model on the ViT side is Google's smallest, cheapest current option (gemini-3.1-flash-lite), not a flagship.
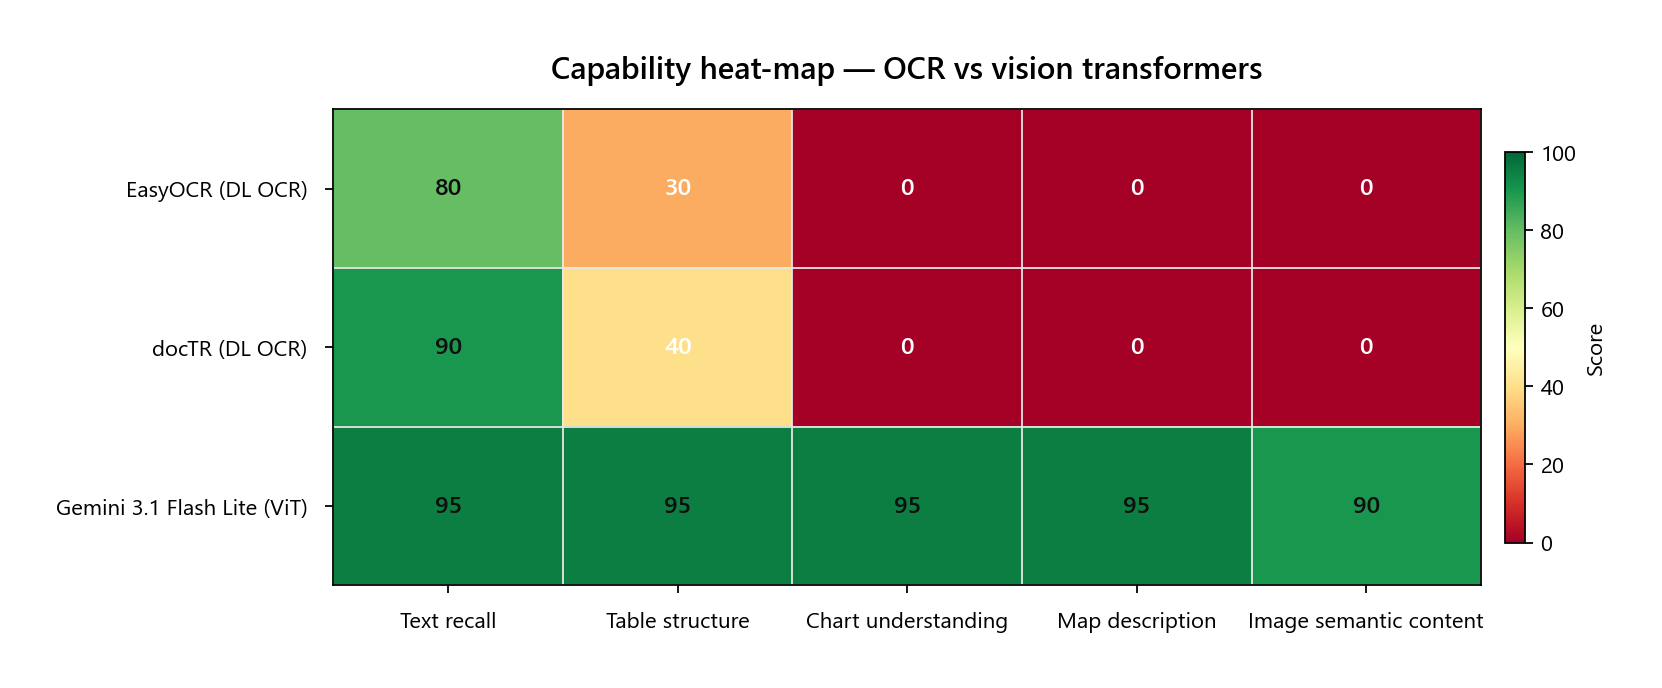
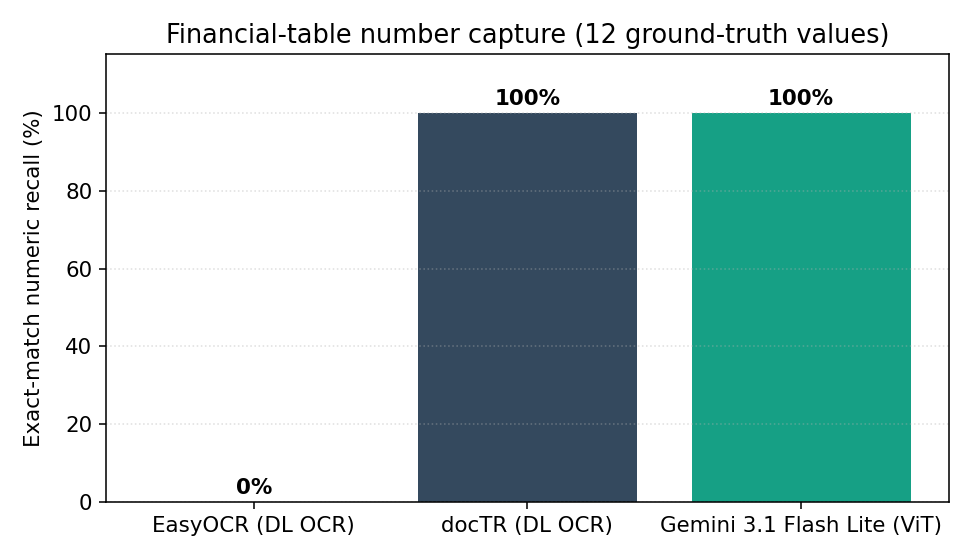
- Numeric recall on a financial table: EasyOCR captured 0 of 12 ground-truth values. Gemini 3.1 Flash Lite captured 12 of 12, preserved as a properly aligned markdown table.
- Structure preservation: Both OCR engines flatten multi-column tables into noisy single-column blobs. The ViT reconstructs row labels, columns, and values in their original layout.
- Visual elements: Neither OCR engine emits a single character about pie charts, world maps, infographics, or photographs. The ViT describes what they show and the values they encode (e.g. "75% Domestic Sales / 25% Export Sales").
- Latency is competitive: Flash Lite finishes a page in about six seconds via API — faster than EasyOCR on three of four test pages on a CPU box.
For a RAG pipeline that retrieves pages from a noisy mix of investor presentations, prospectuses and annual reports, the question is no longer "should we OCR everything?" — it is "why are we still OCR'ing anything that contains a chart?"
What OCR was built to do
Traditional OCR pipelines (Tesseract, ABBYY) and modern deep-learning OCR (EasyOCR, PaddleOCR, docTR) share the same task formulation:
- Detection — find bounding boxes around regions that look like text.
- Recognition — for each box, decode the pixels into Unicode characters.
- Aggregation — concatenate the boxes in approximate reading order.
Crucially, an OCR engine has no opinion about whether a region is a header, a footnote, a table cell, a chart axis label, or a country name floating on a map. There is no semantic output channel. Anything that isn't a glyph is silently dropped on the floor.
For documents that look like a Word page printed to PDF, that's fine. For documents that look like an investor presentation or an annual-report design spread, that's catastrophic.
The benchmark
Four pages from real annual reports were rendered at 144 DPI and run through three engines on the identical input bytes:
- EasyOCR 1.7.2 — PyTorch-based, popular open-source OCR.
- docTR 1.0.1 — Mindee's deep-learning OCR (FAST text detector + CRNN recogniser).
- Gemini 3.1 Flash Lite — Google's smallest current multimodal model, called once with the page image and an extraction prompt (
temperature=0.1).
PaddleOCR 3.5 was also installed and attempted but failed on this Windows machine with a PIR/oneDNN runtime error — a small reminder that "popular OCR library" is not the same as "stable production dependency".
The four pages were chosen to stress different document-understanding skills:
| Page | What's on it | What it stresses |
|---|---|---|
| Chart visual | World map of export markets, pie chart, certification thumbnails | Non-textual content |
| Financial table | Two stacked credit-risk tables with merged headers | Tabular structure |
| Dense text | Plain accounting policy commentary on PP&E | Fairness check — pure text |
| Image captions | Eight project photos in a 4×2 grid with captions | Spatial caption-image binding |
Example 1 — A financial table
Page 118 of Imagine Marketing's standalone financial statements contains two credit-risk tables. The columns are weighted average loss rate, gross carrying amount, and credit impaired. The rows are ageing buckets.
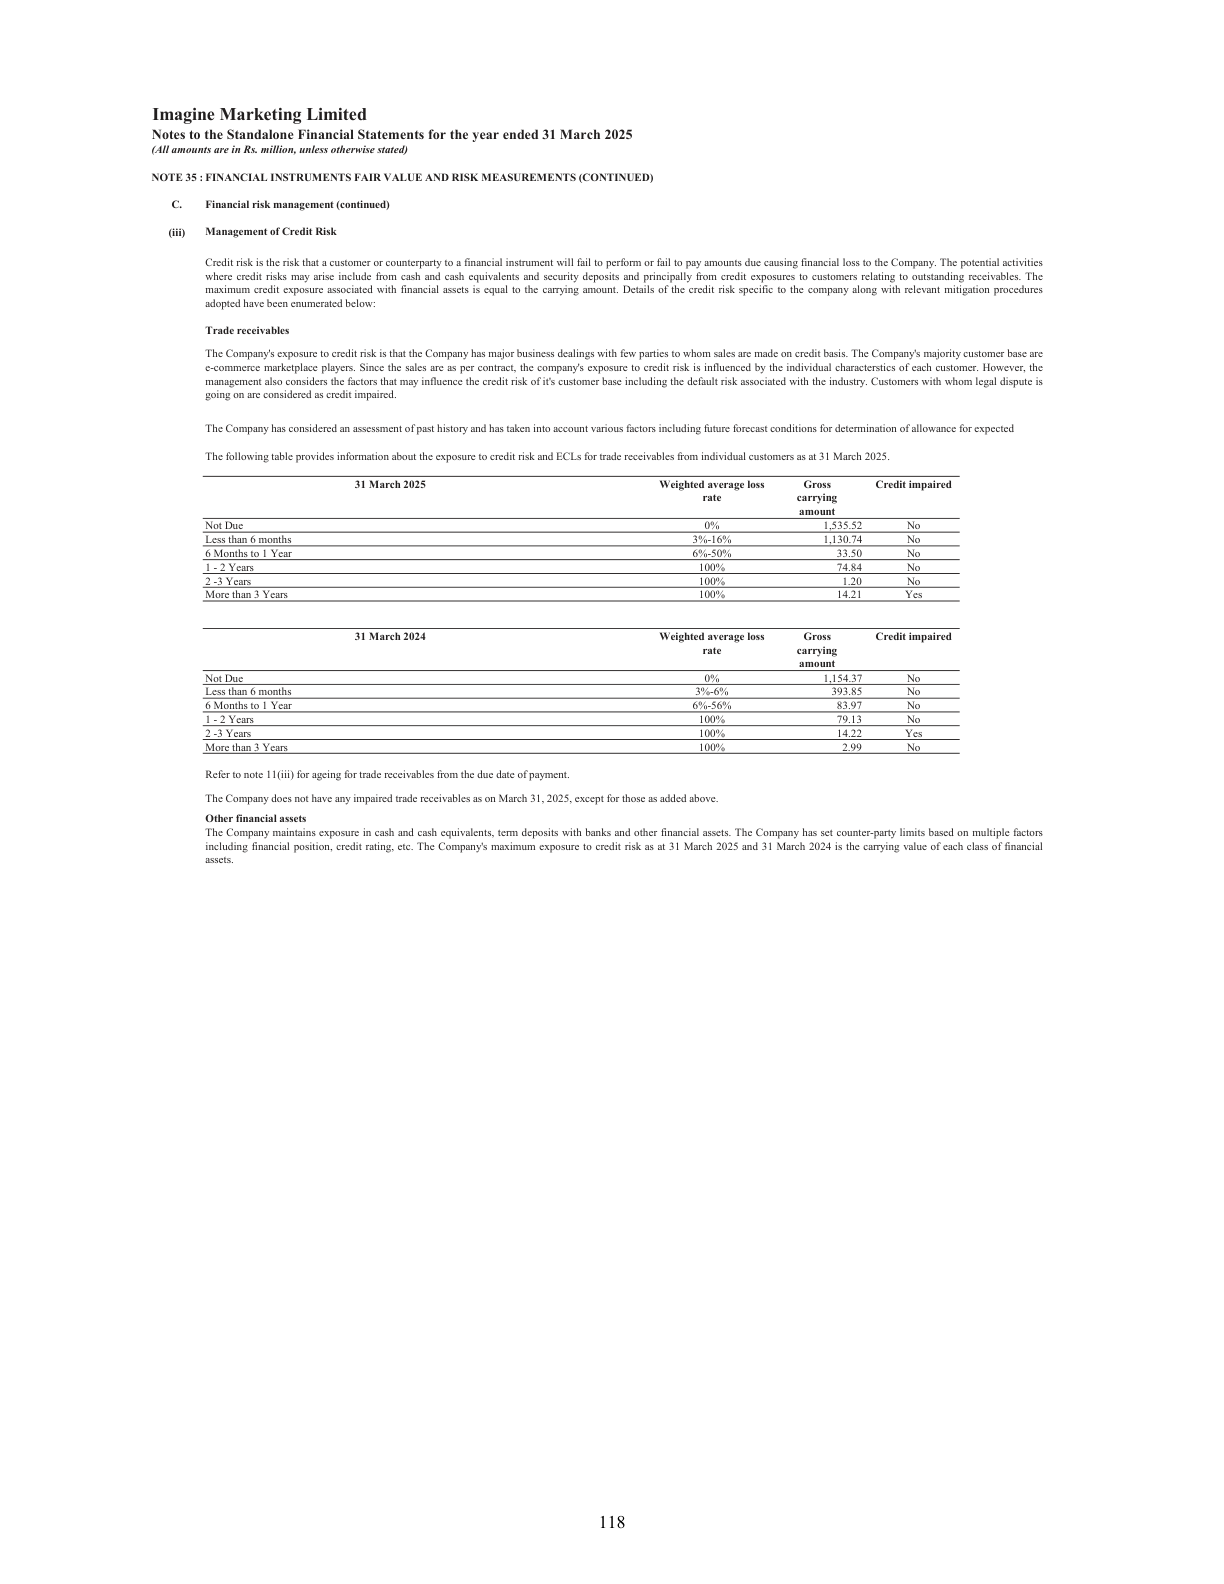
Here is the table region as each engine produced it.
53551
1Su,+
67u-Su u
J-fcr;
2-Ycan:
Mote thun  YWc
15437
393.85
83.97
79.13
14.22
2.99
NotI Due
0%
1,535.52 No
Lesst than6months
3%-16%
1,130.74 No
6Monthstol Year
6%-50%
33.50 No
1-2Years
100%
74.84 No
2-3Years
100%
1.20 No
Moret than3 3Years
100%
14.21 Yes
| Not Due            | 0%     | 1,535.52 | No  |
| Less than 6 months | 3%-16% | 1,130.74 | No  |
| 6 Months to 1 Year | 6%-50% |    33.50 | No  |
| 1 - 2 Years        | 100%   |    74.84 | No  |
| 2 -3 Years         | 100%   |     1.20 | No  |
| More than 3 Years  | 100%   |    14.21 | Yes |

(plus a second table for 31 March 2024 with all
12 ground-truth values aligned to the correct row
and column — and the prose that follows the table,
verbatim.)
Three things to notice:
- EasyOCR mangled the digits. "1,535.52" became "53551" — the model treated the comma and decimal as separators and emitted a string that's worse than useless in a downstream financial pipeline. 0 / 12 numbers recovered
- docTR captured every digit correctly but emitted them as a vertical stream of tokens — the column boundary is gone. A downstream regex parser can recover values, but the mapping between (row, column) is now ambiguous. 12 / 12 numbers, structure lost
- The ViT reconstructed the table. Row labels, column headers, and values are aligned. The Markdown can be parsed straight into a DataFrame. 12 / 12 numbers, structure preserved
The deeper point: even when an OCR engine returns "all the numbers", it returns them without the spatial scaffolding that gives them meaning. 1,535.52 is just a number. "Not Due / 0% / 1,535.52 / No" is a fact. OCR cannot make that leap because reading order is fundamentally a 1-D model imposed on a 2-D artefact.
Example 2 — Graph and chart understanding
This is where the gap stops being "noticeable" and becomes "categorical".
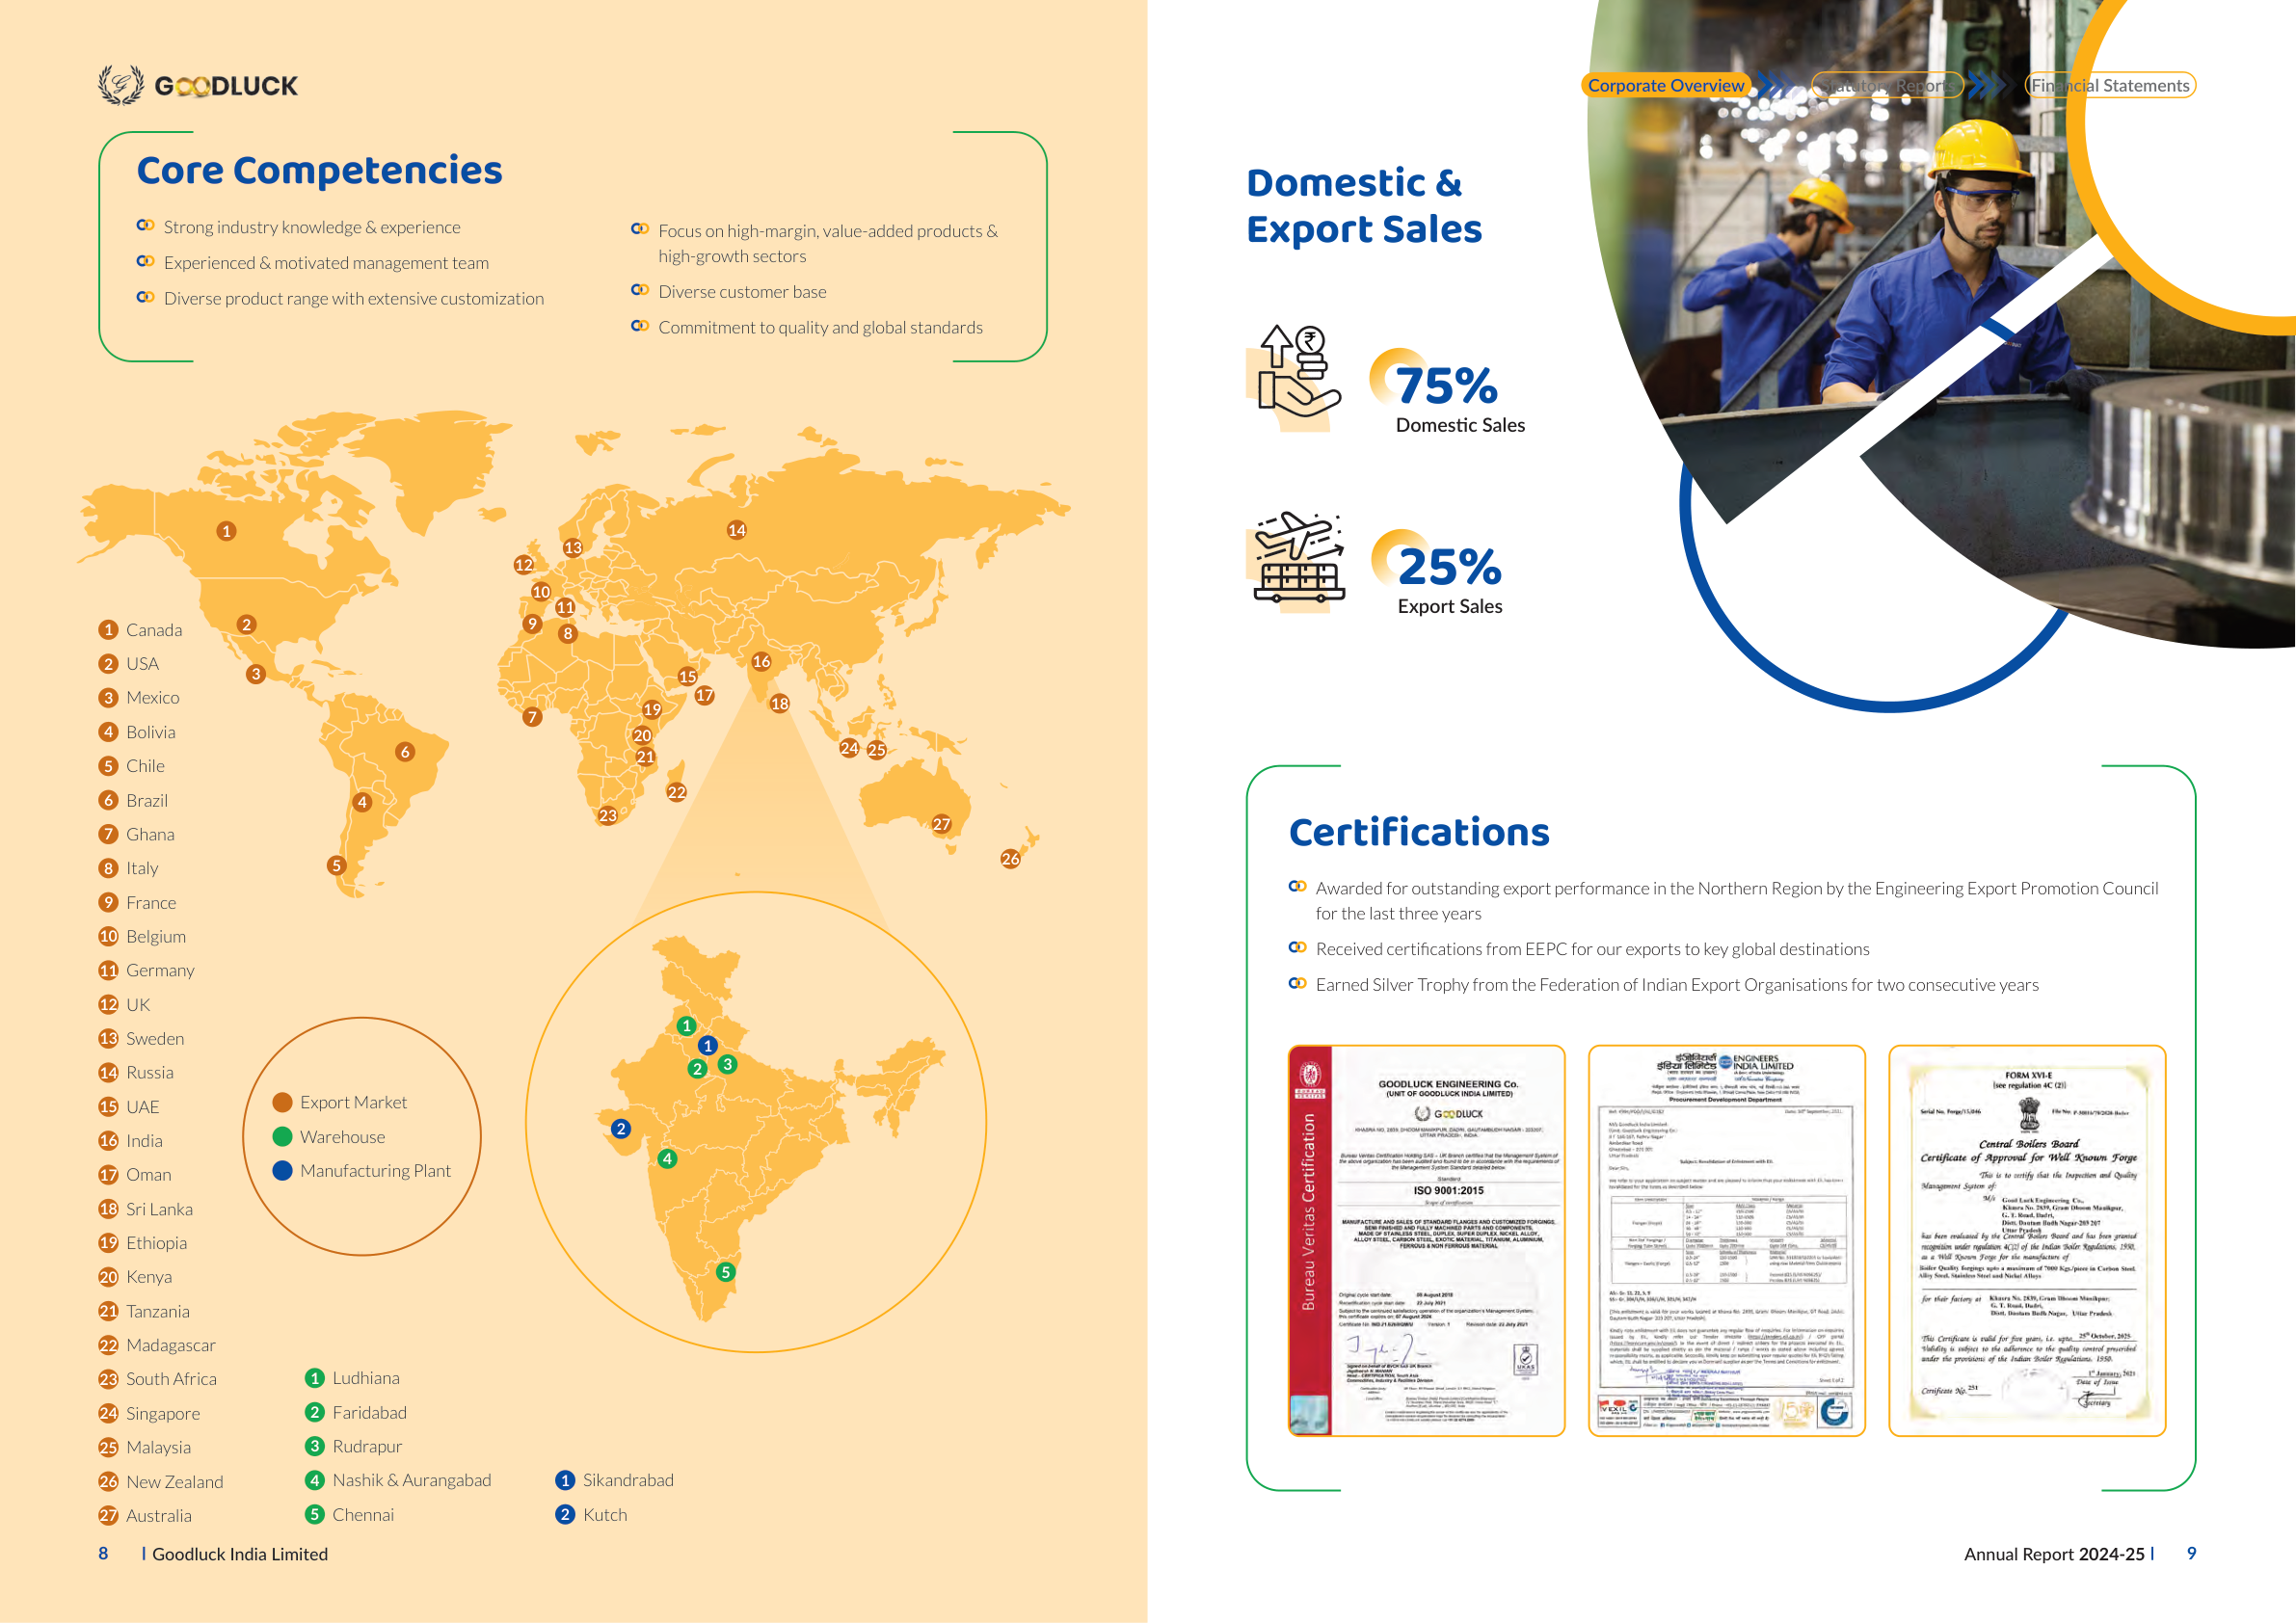
The page contains:
- A world map with 27 numbered export-market locations.
- A zoomed India inset showing warehouses (green) and manufacturing plants (blue).
- A pie-chart-style infographic — 75% Domestic / 25% Export — encoded as icons with percentages.
- Three scanned certification documents with their own small text.
- A bulleted "Core Competencies" section and three certifications callouts.
Ask any OCR engine "what is on this page?" and the answer is a bag of disconnected text tokens — country names floating without a map, "75%" and "25%" floating without a chart, "ISO 9001:2015" floating without a certificate.
Core
Competencies
Domestic &
industry knowledge & experience
Focus on high-margin; value-added products &
Export Sales
...
75%
Domestic Sales
2
25%
Export Sales
Canada
USA
Mexico
...
sis3]
484
Antted
Russia
@
FoRHAt
GOODLUCK ENGINEERING Co
Terulalin
53
OCCDLLCX INC A Limitedi
Export Market
IDoreleomant Daparimt
UAE
ECDWCX
REL
Irtt Edt
Tilteeuit
Acen
India
Warehouse
Central Boilars
JaaTor
Domestic & Export Sales:
  Domestic Sales: 75% (icon of a hand holding a coin).
  Export Sales:   25% (icon of an airplane).

World map highlights 27 export-market locations.
A zoomed-in inset map of India shows
manufacturing plants and warehouses.

Export Market Locations:
1. Canada       10. Belgium     19. Ethiopia
2. USA          11. Germany     20. Kenya
3. Mexico       12. UK          21. Tanzania
4. Bolivia      ...             ...

India Map Legend:
  Manufacturing Plants (blue dots): Sikandrabad, Kutch
  Warehouses (green dots): Ludhiana, Faridabad,
                           Rudrapur, Nashik &
                           Aurangabad, Chennai

Certifications:
  - Bureau Veritas ISO 9001:2015
  - Engineers India Limited (Procurement Dev. Dept.)
  - Certificate of Approval for Well Known Forge
EasyOCR's output for the certification thumbnails is genuinely worth quoting in full: sis3] 484 Antted, FoRHAt, Terulalin 53, OCCDLLCX INC A Limitedi. The OCR engine is trying to do its job — read the pixels — but the pixels in question are a tiny, low-contrast scanned certificate; the optimal answer is not "transcribe the noise letter by letter", it is "this is a certification thumbnail; here's roughly what it certifies". OCR has no escape hatch to that answer. A ViT does.
This is the qualitative difference. Once a model can see the image of the page and not just the letters on it, the entire problem reformulates from "transcribe glyphs" to "describe what is being communicated". And the moment that reformulation happens, charts, diagrams, maps, infographics, and even decorative icons all become first-class queryable objects.
The pie-chart test. Ask the ViT "what is the ratio of domestic to export sales on this page?" — it answers 75 : 25. Ask the same question to EasyOCR's output and you'd have to write a regex to fish out the percentages, then guess (from word proximity) which one is domestic. The reasoning that a human does in 200 ms — "this big slice next to the icon of money means domestic sales" — is not a transformation an OCR pipeline can perform.
An honest caveat
Flash Lite is the smallest model in this family, and it does fumble one detail on this page. Its first sentence about the India inset map says "shows 5 manufacturing plants and 1 warehouse location". The legend two paragraphs down — which the model itself then reads correctly — says the opposite (2 manufacturing plants and 5 warehouses). It contradicted itself inside the same response. For a downstream RAG model reading the full extraction, the correct values are still present and dominate. For a system that reads only the first paragraph, this would matter. Validate row-count and value-range assumptions if you feed the extraction directly into structured records.
Example 3 — Project photos with captions
The second Goodluck spread shows eight engineering projects as photographs with one-line captions.
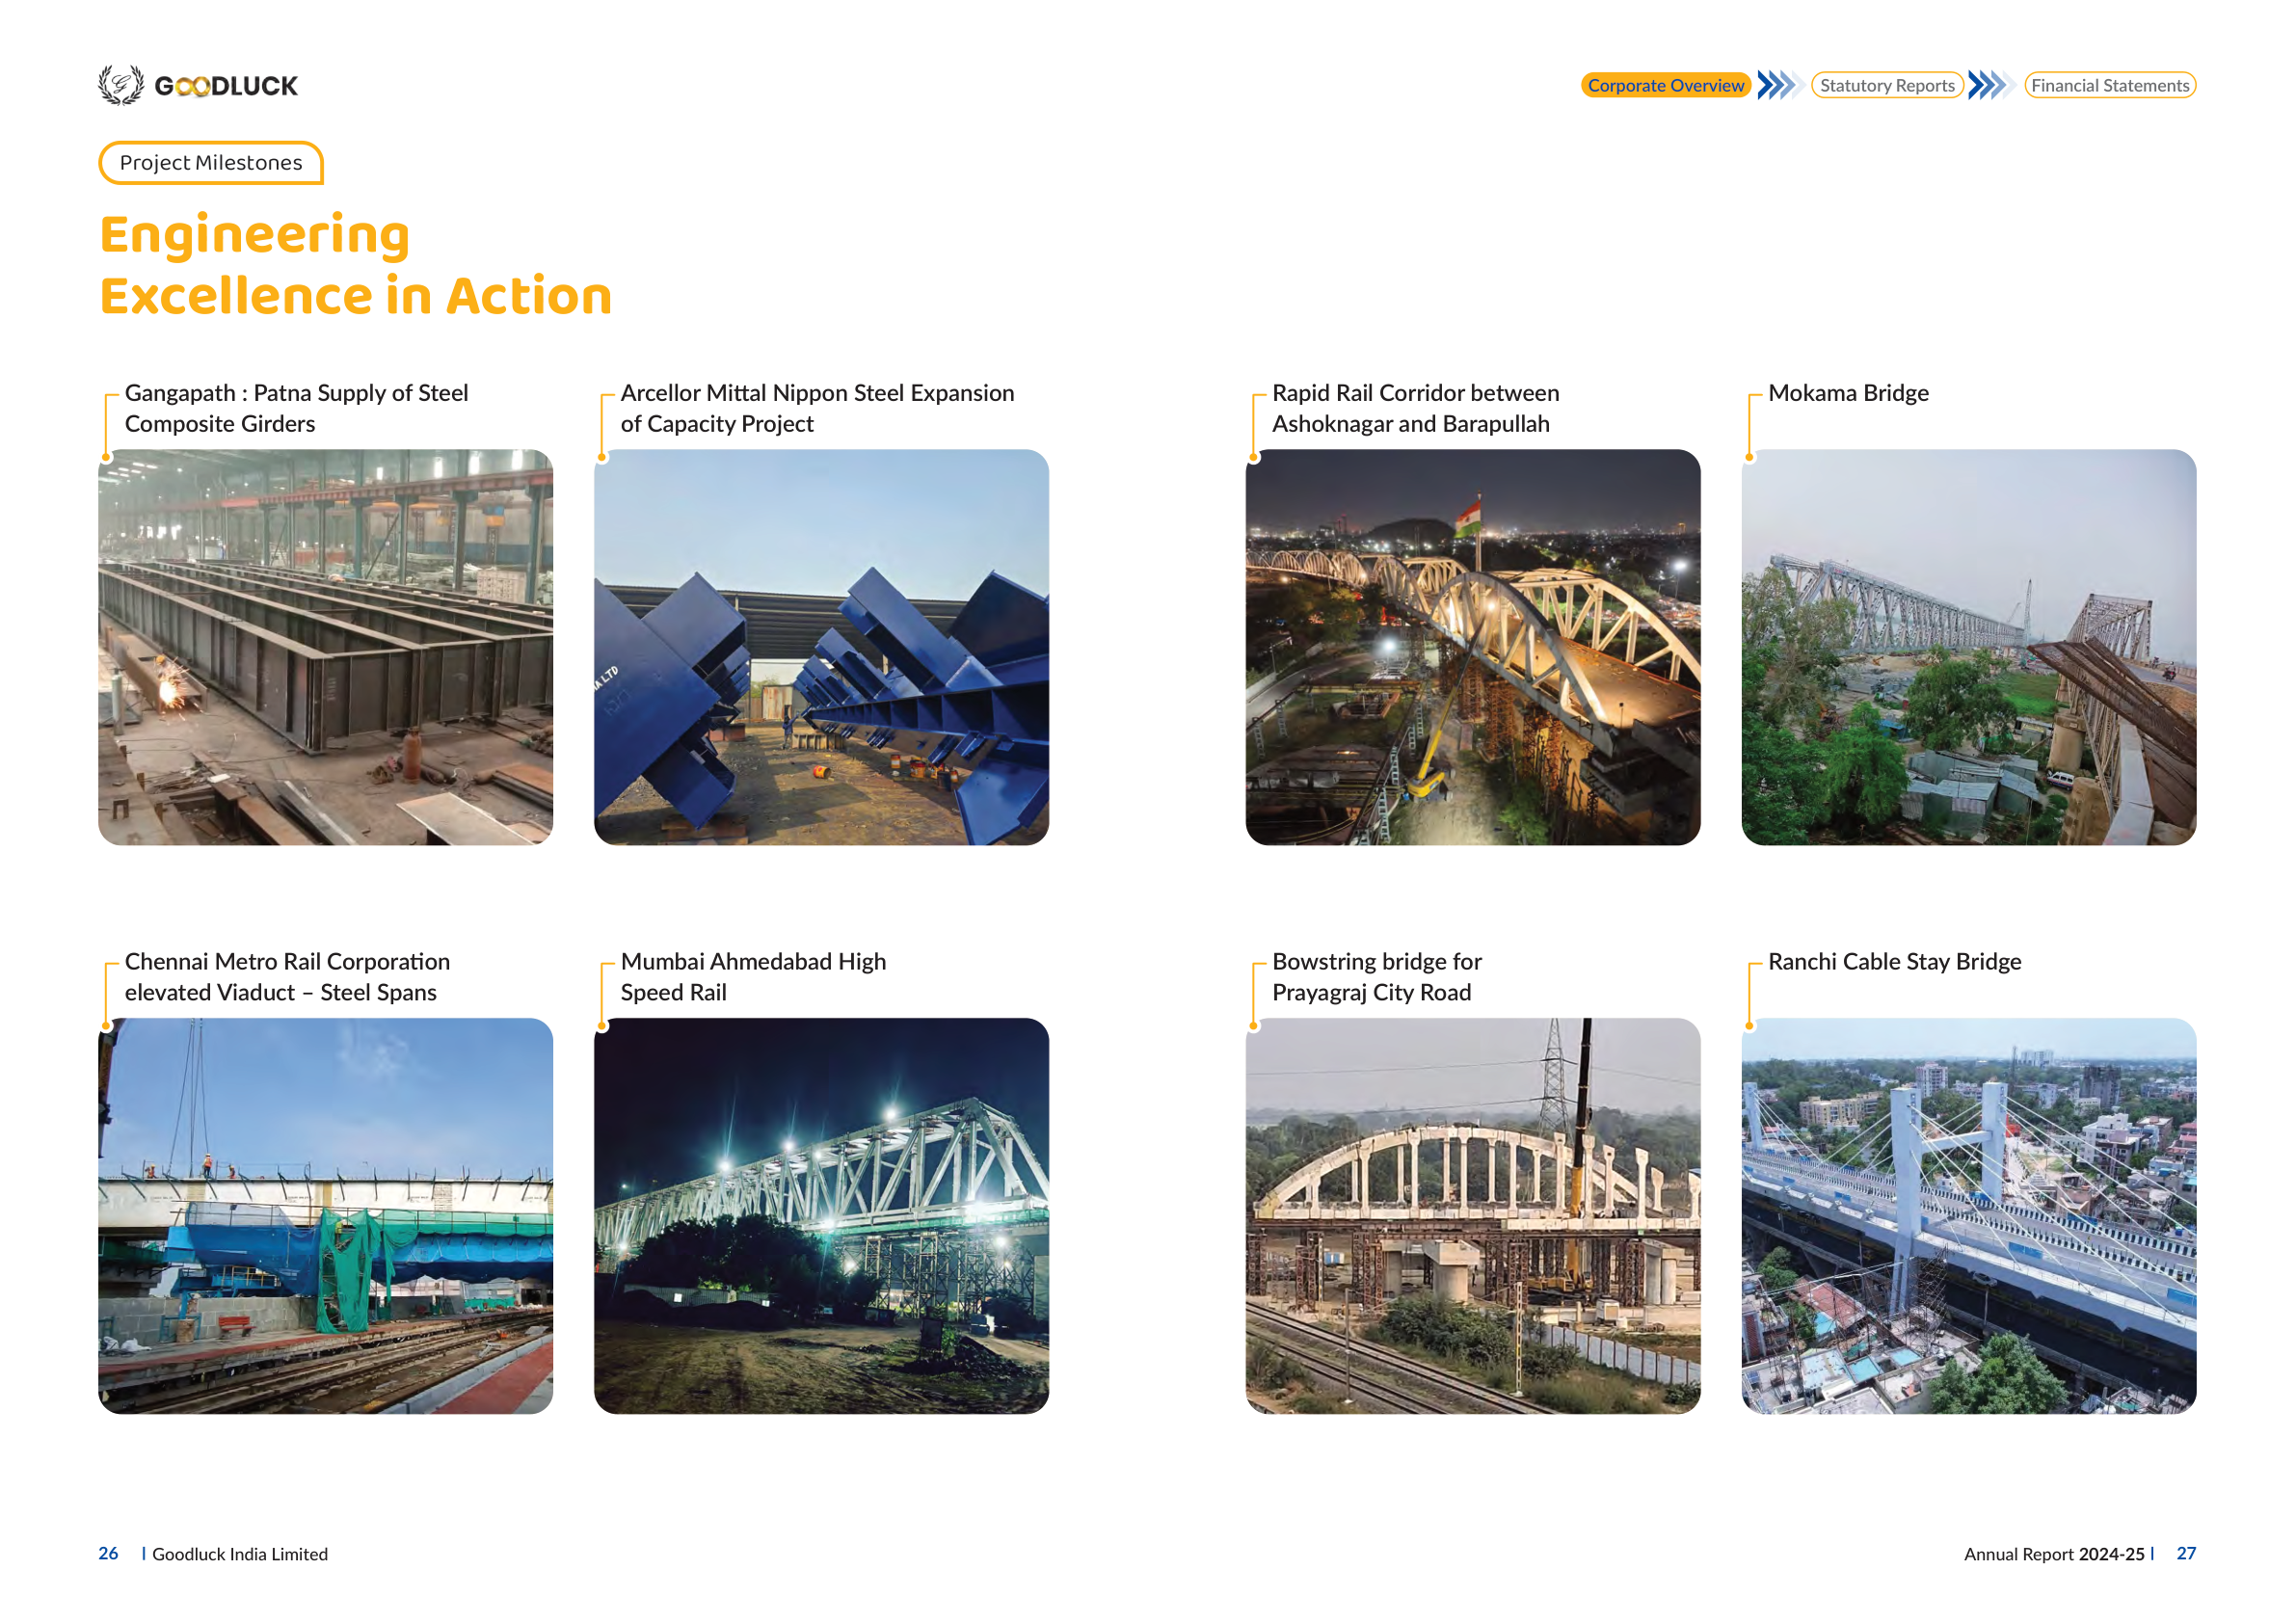
Both OCR engines do a respectable job of pulling the captions (70-80% recall on caption text). But neither says a single word about what is in any of the eight photographs. The ViT, asked to describe the page, produces things like:
"Rapid Rail Corridor between Ashoknagar and Barapullah — a night-time view of a lit-up arched bridge structure with a crane working underneath."
"Mumbai Ahmedabad High Speed Rail — a night-time view of a large steel truss bridge structure illuminated by floodlights."
"Chennai Metro Rail Corporation elevated Viaduct — an elevated metro rail construction site with steel spans and green safety netting."
For a RAG pipeline answering questions like "show me Goodluck's bridge projects", the ViT output is directly indexable. The OCR output requires the user to already know which captions mention bridges — which defeats the point of retrieval. Note that the caption "Chennai Metro Rail Corporation elevated Viaduct — Steel Spans" doesn't itself contain the word "bridge", so an OCR-only index couldn't retrieve it for that query at all.
The numbers — across all four pages
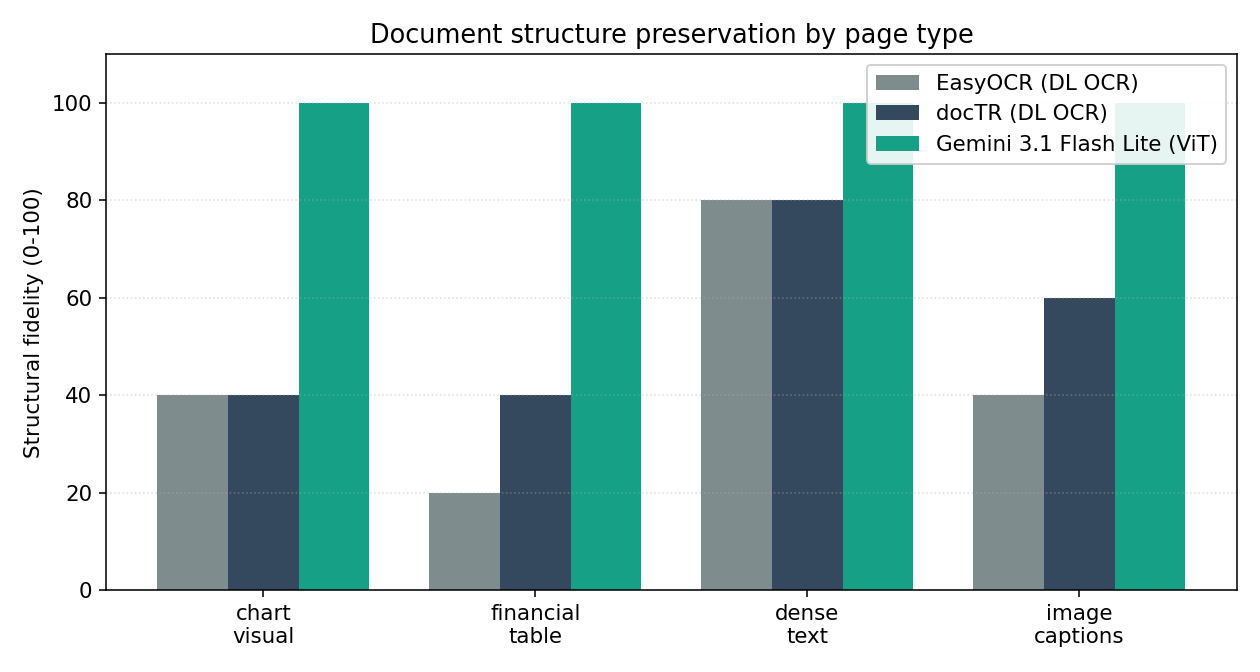
The dense-text page is the fair-fight case: paragraph text, no tables, no charts. There OCR and ViT are roughly tied. That is the niche OCR was actually designed for — and it is also the niche that contains the smallest fraction of pages in a real financial document corpus.
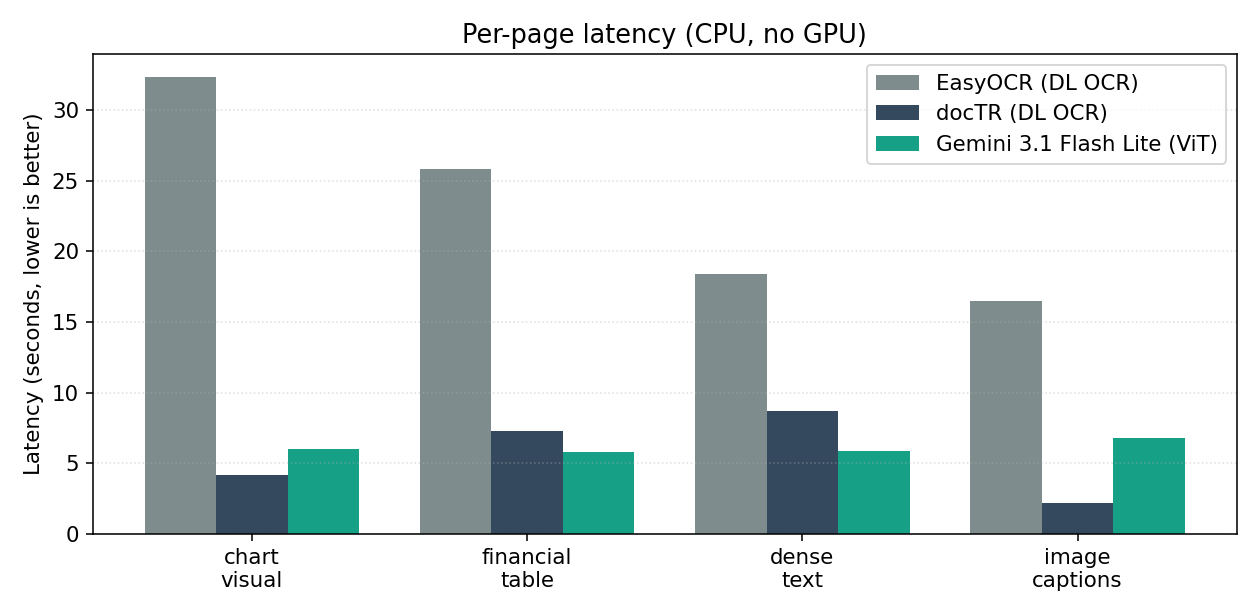
On latency, Flash Lite is competitive with the OCR engines on a CPU box and faster than EasyOCR on three of four pages. That removes the most common deployment objection to multimodal-LLM document extraction — "we can't afford the latency budget". The cost side has the same shape: Lite-tier pricing is materially below the mid-tier multimodal models, so the per-page extraction cost is small enough to be a rounding error on most pipelines.
Why does a ViT do this and an OCR doesn't?
There is no magic. There is a very different architectural choice.
OCR is a chain of narrow models
An OCR pipeline is a hand-engineered cascade: text detection → crop → recognition → reading-order heuristic → concatenate. Every stage produces lossy intermediate representations. The chart-axis annotation is dropped at detection (it's a number floating in whitespace). The pie-chart labels are kept but disconnected from the visual element they describe. The structure of a table is recovered, if at all, by post-processing bounding-box geometry — and only for table-like layouts the heuristic was tuned on.
ViTs treat the page as one signal
A vision transformer divides the page into a uniform grid of patches (typically 14×14 or 16×16 pixels) and embeds each patch into a token. From there, self-attention lets every patch attend to every other patch. A "patch" containing the digit 75% and a "patch" containing the icon of hands holding money can interact directly. The model is free to learn the association "this icon means domestic sales" because patches do not have a designated semantic type — only spatial coordinates and embeddings.
Combined with a language decoder (in Gemini's case, an autoregressive transformer that consumes those visual tokens alongside a text prompt), this lets the model emit any natural-language description of the page — extraction, summary, structured JSON, or answer to a question — without a separate post-processor for each.
That is the architectural story behind the empirical gap. And because the gap is architectural, it does not depend on picking the largest available multimodal model — a Lite-tier one preserves most of the win, as the numbers above show.
What this means for document-extraction pipelines
A typical financial-document RAG pipeline does text retrieval over pre-chunked embeddings (cheap, indexable), then ships the retrieved PDF pages as multimodal input to a vision-language model at generation time. The hybrid is the right shape — text retrieval keeps index size and latency under control, while page-image generation rescues the parts of the page that text extraction permanently lost.
Two practical things follow from the benchmark above:
- The generation-side model can be a Lite-tier multimodal model. Six seconds per page is a budget that fits inside interactive question-answering pipelines, and the structural fidelity on tables and visual fidelity on charts holds.
- The retrieval side is the next frontier. Because today's text-only retrieval cannot fire on chart-only or infographic-only pages — they produce little or no meaningful text chunk — those pages are effectively invisible to the index. ColPali-style late-interaction embeddings or multivector image embeddings (e.g. Jina v4 with
input_type="image"andreturn_multivector=true) close that loop.
Benchmark notes — single-page latency measured on a CPU-only Windows 11 laptop (Python 3.12). EasyOCR weights were downloaded on first run; the figures above are warm-cache numbers. Gemini calls go through gemini-3.1-flash-lite with temperature=0.1.